
“Zé Pequeno: Can you read?
Gang Member: I can read only the pictures.”
– City of God (2002) directed by Fernando Meirelles and Kátia Lund
“Yet in opinions look not always back,–
Your wake is nothing, mind the coming track;
Leave what you’ve done for what you have to do;
Don’t be “consistent,” but be simply true.”– Oliver Wendell Holmes Sr.
This week’s piece is lighter in words, heavier in charts. As we begin looking forward to 2019 we share some recent market developments that have caught our attention. For now there are more questions and observations than there are answers and actions.
Before getting to the charts, a few updates related to topics we have written about in the recent past.
Updates
1. President Trump has named US Trade Representative Robert E. Lighthizer to lead trade negotiations with China following the post-G20 meeting between President Trump and President Xi
From the Wall Street Journal:
President Trump named a China hard-liner to lead negotiations with Beijing, indicating the U.S. will pursue a tough stance in what is bound to be contentious talks over a trade dispute that has sent shivers through global markets.
Mr. Trump informed Chinese President Xi Jinping of his choice of Robert Lighthizer at their Saturday meeting in Buenos Aires, people familiar with the discussions said, pointing several times to the U.S. Trade Representative as the person who will face off with Beijing’s diplomats and using Mr. Lighthizer’s charts in presentations.
The remarks came as a surprise to a Chinese leadership that had maneuvered for months to deal with Treasury Secretary Steven Mnuchin, who had led initial rounds of talks, but failed to resolve the dispute over the past year.
The post-G20 niceties did not last very long and the positive developments of trade negotiations have unravelled rather quickly. The appointment of China hawk Robert E. Lighthizer to lead negotiations, we think, is a clear signal of intent by the Trump Administration – there is unlikely to be a breakthrough in US-Chinese trade talks any time soon.
Matters have deteriorated even further with arrest of Meng Wanzhou, Huawei Technologies’s chief financial officer and daughter of the company’s founder, by Canadian authorities in Vancouver at the request of the US. US authorities allege that Ms. Meng and Huawei violated economic sanctions placed on Iran and have submitted an extradition request for Ms. Meng.
The arrest aside, if the US government moves to sanction Huawei, it will be hurting US businesses such as Micron, Microsoft and Qualcomm, which count Huawei amongst their major customers. It will not be the first time the Trump Administration directly harms US corporate interests in its bid to punish China for the violation of sanctions or for intellectual property theft.
In October, the US Commerce Department placed export controls on American companies to restrict them from selling software and technology goods to Fujian Jinhua Integrated Circuit. Fujian Jinhua is a semiconductor startup supported by the Chinese government as part of the efforts to develop its own semiconductor industry.
Investors should avoid investing in American B2B technology, aerospace and defense companies with significant commercial interests in China.
2. Intel: The next company to be “Amazoned”?
From Bloomberg (emphasis added):
Amazon.com Inc. has taken a big step toward reducing reliance on Intel Corp. for a critical component of its cloud-computing service.
The largest cloud company unveiled its own server processors late Monday and said the Graviton chips will support new versions of its main EC2 cloud-computing service. Until now, Amazon — and other big cloud operators — had almost exclusively used Intel Xeon chips.
[…]
Intel processors run more than 98 per cent of the world’s servers, and owners of massive data centers such as Amazon, Microsoft Corp. and Google have become some of its biggest customers. While these internet giants have driven down the price of most components by doing a lot of their own engineering, Intel’s Xeon chips have resisted that pressure. The average selling price of these processors has risen over time, something that almost never happens in the electronic industry.
As Jeff Bezo’s famously said: “Your margin is my opportunity.”
Charts
1. Watch the 48 month moving average of gold
The logarithmic chart of the price of gold:

Gold has been flirting with its 48-month moving average for more than 18 months. If it can get above the moving average and gather some momentum. We would be buyers of gold.
In the second panel in the chart below, we can see, using the 48-month rate of change in the price of gold, the barbarous relic has failed to gather momentum in recent months. A step up (down) in momentum would be quite bullish (bearish) given the relative narrowness of the trading range over the last three years.

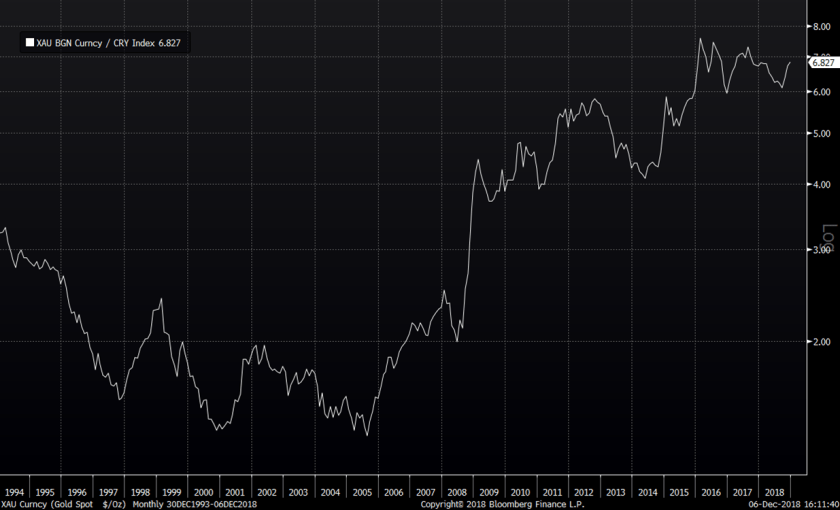
Gold has once again started out performing the broader commodity complex (the chart below is the price of gold divided by the CRB spot commodity index) after under performing during the first half of the year.
Over the longer-term, we can see the start of gold’s out performance over the commodity index dates back to late 2005 and the trend remains in favour of gold for now.
2. The US dollar is losing momentum despite its strength
The dollar index $DXY is right above its 48-month moving average, having intermittently broken below it at the start of the year. The greenback, however, is losing momentum (second panel) with the 48-month rate of change making lower highs despite the continued strength in the dollar.

3. Emerging markets have been out performing the S&P 500 since early October
Emerging markets hit their recent lows at the end of October (top panel) but started outperforming the S&P 500 starting early October (bottom panel).
Coincidentally, emerging market out performance started soon after the deadline for tax-breaks for pension contributions by US corporations passed. Pension contributions made through mid-September of this year were deductible from income on tax returns being filed for 2017 — when the US corporate tax rate was still 35 per cent as compared to the 21 per cent in 2018. This one-time incentive encouraged US corporations to bring forward pension plan contributions and is likely to have had an out sized impact on US assets relative to non-US assets.

Whilst not definitive by any means, the gold, US dollar and emerging markets charts, we think, appear to be sending the same message: weaker dollar, stronger commodities and non-US markets out performance relative to US markets.
4. Despite all the bad news, China too has stopped under performing the US
The signal from China is the weakest but follow through has the potential to be the strongest across emerging markets.
Chinese markets have remained above mid-October lows despite all the bad news in recent weeks. If the lows hold, we suspect China is likely to outperform the US in 2019.

5. In the US, it is time to sell the rallies in growth to re-balance to value
The below chart shows the ratio of the S&P 500 Growth Index to the S&P 500 Value Index. Given the ratios distance from its 36-month moving average, portfolios should gradually be shifting away from growth to value over the course of 2019.

This post should not be considered as investment advice or a recommendation to purchase any particular security, strategy or investment product. References to specific securities and issuers are not intended to be, and should not be interpreted as, recommendations to purchase or sell such securities. Information contained herein has been obtained from sources believed to be reliable, but not guaranteed.
One thought on “Charts and Updates”
Comments are closed.