
“Here’s something to think about: How come you never see a headline like ‘Psychic Wins Lottery’?” – Jay Leno
“Nothing in life is as important as you think it is when you are thinking about it.” – Thinking, Fast and Slow, Daniel Kahneman
“I hate to lose more than I love to win.” – Jimmy Connors
Prospect Theory, developed by Daniel Kahneman and Amos Tversky in 1979, is a descriptive model that characterises how people choose between different options and how they estimate the perceived likelihood of each of these options. The main findings of Prospect Theory are:
- People care about gains or losses more than about overall wealth;
- People exhibit loss aversion and can be risk seeking when facing the possibility of loss; and
- People overweight low-probability events.
The Chicago Board Options Exchange Volatility Index, better known as the VIX, is the primary gauge used by equity and options traders to monitor the anxiety level of market participants. The VIX measures the market’s expectation of 30-day volatility of the S&P 500 index. The higher VIX is, the higher the anxiety levels amongst market participants.
Market participants can express their view on short-term market volatility through a number of instruments. Two of the most common ways used are selling options on an equity index or by shorting the VIX. As equities tend to decline as volatility rises, the preference amongst market participants is to sell puts over selling calls. Added to that, puts are usually more expensive than calls; selling puts generates a higher premium.
Selling volatility, using either equity index options or by shorting the VIX, is the capital markets equivalent to selling lottery tickets. Large losses in a strategy involving selling volatility tend to coincide with market crashes. Large but rare losses, i.e. negative skewness, justify a positive risk premium for the strategy.
Selling volatility on equity indices has provided attractive payoffs over long periods of time. The strategy had a high long-run Sharpe ratio over the two decades between the 1987 crash and the 2008 Global Financial Crisis. Even higher levels of performance have been achieved by the strategy since the equity market lows in 2009. The reason the strategy has been profitable is largely due to implied volatilityon equity indices consistently trading at a premium over realised volatility. Based on monthly data from 2005 till date, as shown in the chart below, the average differential between the implied and realised volatility on the S&P 500 index is 1.2%.
S&P 500 Index Implied Volatility less Realised Volatility
 Source: Bloomberg
Selling volatility has become a very popular trade, to say the least. The proliferation of exchange traded funds (ETFs) and exchanged traded notes (ETNs) that track either the performance or the inverse of the performance of the VIX has made selling or buying volatility, otherwise complicated trades to structure, accessible for the average investor. Investors can go long the inverse VIX instruments or short the long VIX products if they want to sell volatility.
Based on the tenets of Prospect Theory, the popularity of short volatility strategies is somewhat confounding. By investing in such strategies, investors are under weighting as opposed to over weighting a low probability event (a market crash). At the same time, they are giving preference to negative skewness, favouring small gains at the risk of incurring large losses.
During October, 2017, the VIX recorded its lowest monthly average since the launch of the index dating back to January, 1993. What makes this statistic even more remarkable is that autumn months are generally more volatile with October being, on average, the most volatile month during the year. The average level of the VIX for October, starting 1993, is 21.8 – more than double the 10.1 averaged last month.
Proshares Short VIX Short Term Futures ETF Price Performance  Source: Bloomberg
With volatility recording all-times lows and equity markets at all-time highs, some have called selling volatility the “most dangerous trade in the world” while others expect an inevitable rise in volatility to cause a significant correction in US equity markets. While these views may prove to be correct, our view is slightly more nuanced.
The increased availability of volatility instruments has made trading volatility more liquid than it used to be. Just as other securities benefit from a re-rating as their liquidity improves, volatility has structurally re-priced due to the proliferation of vehicles facilitating short and long volatility trades. We do not know the degree to which this increased liquidity should improve valuation but accept that volatility should be lower than it used to be prior to this structural shift.
Another reason why we think volatility should be structurally lower today than it used to be is the rise of passive investing. Passive investment vehicles are gathering an increasing share of assets and deploying them in systematic manner. A systematic allocation strategy is by construct more predictable, less volatile than a discretionary allocation strategy.
Taleb, in his paper “Bleed or Blowup? Why Do We Prefer Asymmetric Payoffs?” featured in the Journal of Behavioral Finance in 2004, argues that the growth of institutional fund management also contributes to the rise in the negative skewness bias. We consider the case for money managers preferring investment strategies exhibiting negative skewness to be credible as such strategies superficially boost Sharpe ratio over extended periods of time, supporting asset gathering efforts.
With all that being said, we do consider the short volatility trade to be richly valued. That does not mean we expect the equity market to crash, instead the differential between implied and realised volatility has tightened to such a degree that this gap can easily close and invert. The trade can become loss making without a meaningful correction in equity markets.
Investment Perspective
The S&P 500 index’s implied volatility is almost two standard deviations below its average over the last 7 years. Not being psychics and being cognisant of the incremental improvements in the economy, we are not calling for a significant correction in the overall market. However, such low levels of volatility, in our opinion, are bound to lead to investor complacency in areas of the market that do not warrant it. And it is these areas of the market we search for to avoid or short. While at the same time we also search for areas where anxiety levels are extended and have the potential to revert back towards the mean.
S&P 500 Index Historical Implied Volatility Source: Bloomberg
In our search we have found two sectors where we find unwarranted levels of complacency: airlines and cable & satellite and broadcasting businesses.
Capacities are rising in the airline sector at a time where costs are also rising. Airlines have enjoyed a significant tailwind due to the crash in oil prices; however, oil prices are rising and we expect further upside to oil prices from here. This will be a major headwind for airlines at a time when there are already cost pressures from rising salaries for pilots due to a shortage of qualified pilots. Despite the headwinds, implied volatility for airlines stocks are at one to two standard deviations below their averages.
Southwest Airlines Historical Implied Volatility
Source: Bloomberg
American Airlines Historical Implied Volatility Source: Bloomberg
Delta Airlines Historical Implied Volatility  Source: Bloomberg
Cable & satellite and broadcasting businesses face structural issues that bring into question the viability of their business models. These issues are similar to the challenges faced by advertising agencies that we have articulated in Unbranded: The Risk in Household Consumer Names. Despite the challenging outlook, we find investor complacency to be high in a number of names within the sector.
CBS Historical Implied Volatility  Source: Bloomberg
We consider the shorting of stocks in the sectors with challenging prospects combined with high levels of investor complacency, as a means to selectively reduce short volatility exposure or to go long volatility without the time decay or negative carry of direct long volatility trades.
To complement our short ideas, we have also identified one area of the market where we find high levels of anxiety after significant draw downs have already taken place: the general merchandising sector. While there is still potential for further pain in the overall retail sector, we find there is an opportunity to pick up the pieces in a segment where we find some value.
Target Historical Implied Volatility  Source: Bloomberg
Dollar General Historical Implied Volatility 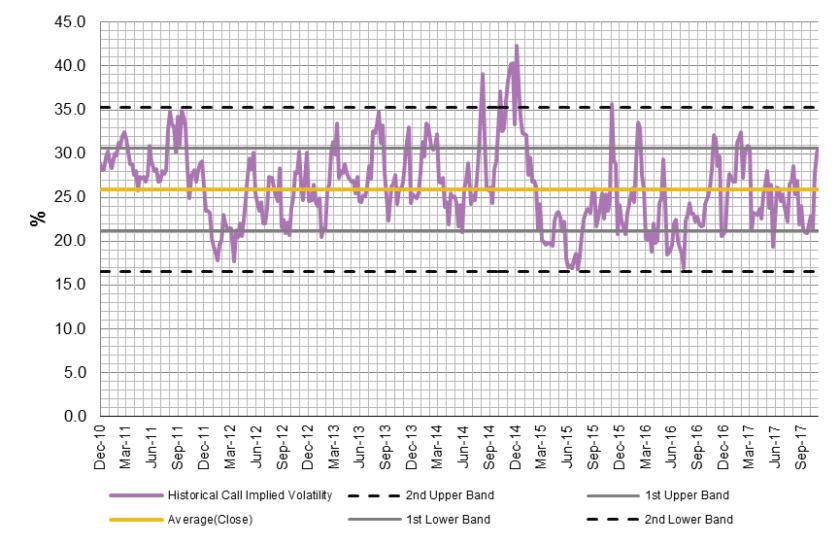 Source: Bloomberg
Dollar Tree Historical Implied Volatility  Source: Bloomberg
We are long target ($TGT), Dollar General ($DG) and Dollar Tree ($DLTR) and are short Southwest Airlines ($LUV), American Airlines ($AAL), Delta Airlines ($DAL) and CBS ($CBS).
This post should not be considered as investment advice or a recommendation to purchase any particular security, strategy or investment product. References to specific securities and issuers are not intended to be, and should not be interpreted as, recommendations to purchase or sell such securities. Information contained herein has been obtained from sources believed to be reliable, but not guaranteed.